Wave energy potential in Poland

The total coastlines of Poland :

770 km on the Baltic Sea

Coastal population percentage :

50%

The average wave energy :

2.5 KW/m

Wave energy theoretical potential :

17 TWh/y

Wave energy applicable potential :

0.90 TWh/y

Total electricity consumption:

156.91 TWh (2016)

Tide & Wave energies sharing to the total electricity production :

0 MWh (0.00%)

Wave energy index : wave energy applicable potential % Electricity consumption

0.60%

Wave energy potential in Albania

The total coastlines of Albania :

450 km on the Adriatic sea

Coastal population percentage :

50%

The average wave energy :

2.5 KW/m

Wave energy theoretical potential :

10 TWh/y

Wave energy applicable potential :

0.5 TWh/y

Total electricity consumption:

7.13 TWh (2016)

Tide & Wave energies sharing to the total electricity production :

0 MWh (0.00%)

Wave energy index : wave energy applicable potential % Electricity consumption

7%

Wave energy potential in Montenegro

The total coastlines of Montenegro :

294 km on the Adriatic Sea

Coastal population percentage :

60%

The average wave energy :

2.5 KW/m

Wave energy theoretical potential :

7 TWh/y

Wave energy applicable potential :

0.40 TWh/y

Total electricity consumption:

1.21 TWh (2016)

Tide & Wave energies sharing to the total electricity production :

0 MWh (0.00%)

Wave energy index : wave energy applicable potential % Electricity consumption

33%

Coastal least developed countries

Least developed countries

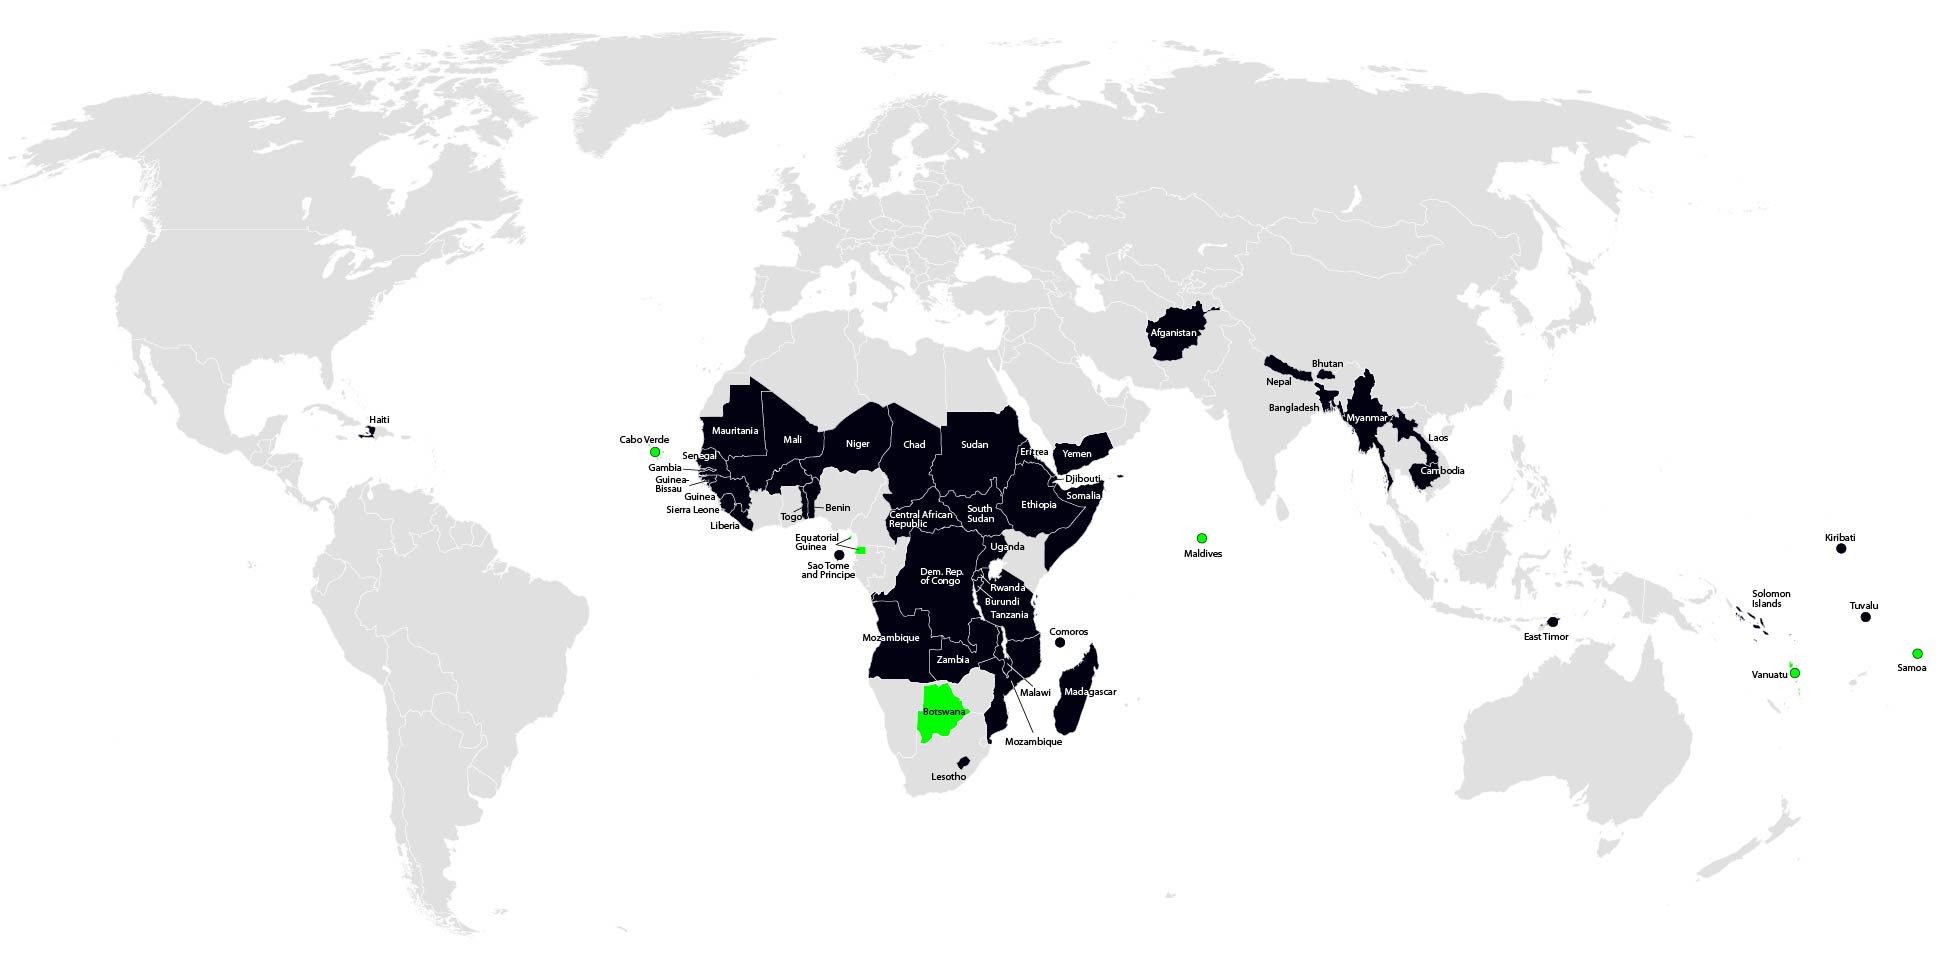
The least developed countries (LDCs) is a list of developing countries that, according to the United Nations, exhibit the lowest indicators of socioeconomic development, with the lowest Human Development Index ratings of all countries in the world. The concept of LDCs originated in the late 1960s and the first group of LDCs was listed by the UN in its resolution 2768 (XXVI) of 18 November 1971.

A country is classified among the Least Developed Countries if it meets three criteria:

Poverty – adjustable criterion based on GNI per capita averaged over three years. As of 2018 a country must have GNI per capita less than US$ 1,025 to be included on the list, and over $1,230 to graduate from it.

Human resource weakness (based on indicators of nutrition, health, education and adult literacy).

Economic vulnerability (based on instability of agricultural production, instability of exports of goods and services, economic importance of non-traditional activities, merchandise export concentration, handicap of economic smallness, and the percentage of population displaced by natural disasters).

As of December 2020, 46 countries are classified as LDC, while six have been upgraded between 1994 and 2020. The WTO recognizes the UN list and says that “Measures taken in the framework of the WTO can help LDCs increase their exports to other WTO members and attract investment. In many developing countries, pro-market reforms have encouraged faster growth, diversification of exports, and more effective participation in the multilateral trading system.”

Coastal least developed countries

Countries that belong to this category and have coasts, and their number

In Africa , there is 33 countries that are classified as least developed countries
And 20 of them it coastal countries :

Angola
Benin
Comoros
Democratic Republic of the Congo
Djibouti

Eritrea
Gambia
Guinea
Guinea-Bissau
Liberia
Madagascar
Mauritania
Mozambique
São Tomé and Príncipe
Senegal
Sierra Leone
Somalia
Sudan
Tanzania
Togo

In the Americas (North America , South America), there is 1 country that is classified as a least developed country:

Haiti

In Asia, there is 9 countries that are classified as least developed countries , 5 of them are coastal countries :

Bangladesh
Cambodia
East Timor
Myanmar
Yemen

​In Oceania, there is 3 countries that are classified as least developed countries:

Kiribati
Solomon Islands
Tuvalu

Wave Energy Potential in Tuvalu

Tuvalu has 24 Km of coastline in the Pacific ocean

Coastline (km) : 24

Coastal population percentage (%) : 90

The average wave power on the coast (kw/m) : 12.5

Wave energy theoretical potentials (Twh/year) : 3

Wave energy applicable potentials (Twh/year) : 0.13

Electricity consumption : 0.01 TWh (2016 est.)

wave energy index (%) : 1,180

Electricity access
electrification – total population: 99% (2019)

electrification – urban areas: 100% (2019)

electrification – rural areas: 98% (2019)

Electricity – from fossil fuels
100% of total installed capacity (2016 est.)

Electricity – from hydroelectric plants
0% of total installed capacity (2017 est.)

Electricity – from other renewable sources
0% of total installed capacity (2017 est.)

Wave Energy Potential in Solomon Islands

Solomon Islands has 5,313 Km of coastline in the Pacific ocean

Coastline (km) : 5,513

Coastal population percentage (%) : 90

The average wave power on the coast (kw/m) : 12.5

Wave energy theoretical potentials (Twh/year) : 582

Wave energy applicable potentials (Twh/year) : 29

Electricity consumption : 0.01 TWh (2016 est.)

wave energy index (%) : 290,000

Electricity access
electrification – total population: 66.6% (2019)

electrification – urban areas: 76% (2019)

electrification – rural areas: 63% (2019)

Electricity – from fossil fuels
92% of total installed capacity (2016 est.)

Electricity – from hydroelectric plants
0% of total installed capacity (2017 est.)

Electricity – from other renewable sources
8% of total installed capacity (2017 est.)

Wave Energy Potential in Kiribati

Kiribati has 1,143 Km of coastline in the Pacific ocean

Coastline (km) : 1,143

Coastal population percentage (%) : 90

The average wave power on the coast (kw/m) : 30

Wave energy theoretical potentials (Twh/year) : 300

Wave energy applicable potentials (Twh/year) : 15

Electricity consumption : 0.027 TWh (2016 est.)

wave energy index (%) : 55,000

Electricity access
electrification – total population: 100% (2020)

Electricity – from fossil fuels
73% of total installed capacity (2016 est.)

Electricity – from hydroelectric plants
0% of total installed capacity (2017 est.)

Electricity – from other renewable sources
27% of total installed capacity (2017 est.)

Wave Energy Potential in Haiti

Haiti has 1,771 Km of coastline in the Caribbean sea

Coastline (km) : 1,771

Coastal population percentage (%) : 90

The average wave power on the coast (kw/m) : 7.5

Wave energy theoretical potentials (Twh/year) : 116

Wave energy applicable potentials (Twh/year) : 6

Electricity consumption : 0.41 TWh (2016 est.)

wave energy index (%) : 1,463

Electricity access
electrification – total population: 39% (2019)

electrification – urban areas: 60% (2019)

electrification – rural areas: 12% (2019)

Electricity – from fossil fuels
82% of total installed capacity (2016 est.)

Electricity – from hydroelectric plants
18% of total installed capacity (2017 est.)

Electricity – from other renewable sources
0% of total installed capacity (2017 est.)

Wave Energy Potential in Yemen

Yemen has 1,906 Km of coastline on the Indian ocean

Coastline (km) : 1,906

Coastal population percentage (%) : 35

The average wave power on the coast (kw/m) : 6

Wave energy theoretical potentials (Twh/year) : 100

Wave energy applicable potentials (Twh/year) : 5

Electricity consumption : 3.68 TWh (2016 est.)

wave energy index (%) : 136

Electricity access
electrification – total population: 47% (2019)

electrification – urban areas: 72% (2019)

electrification – rural areas: 31% (2019)

Electricity – from fossil fuels
79% of total installed capacity (2016 est.)

Electricity – from hydroelectric plants
0% of total installed capacity (2017 est.)

Electricity – from other renewable sources
21% of total installed capacity (2017 est.)

Wave Energy Potential in Myanmar (Burma)

Myanmar has 1,930 Km of coastline on the Indian ocean

Coastline (km) : 1,930

Coastal population percentage (%) : 65

The average wave power on the coast (kw/m) : 12.5

Wave energy theoretical potentials (Twh/year) : 211

Wave energy applicable potentials (Twh/year) : 11

Electricity consumption : 14.93 TWh (2016 est.)

wave energy index (%) : 74

Electricity access
electrification – total population: 51% (2019)

electrification – urban areas: 76% (2019)

electrification – rural areas: 39% (2019)

Electricity – from fossil fuels
39% of total installed capacity (2016 est.)

Electricity – from hydroelectric plants
61% of total installed capacity (2017 est.)

Electricity – from other renewable sources
1% of total installed capacity (2017 est.)