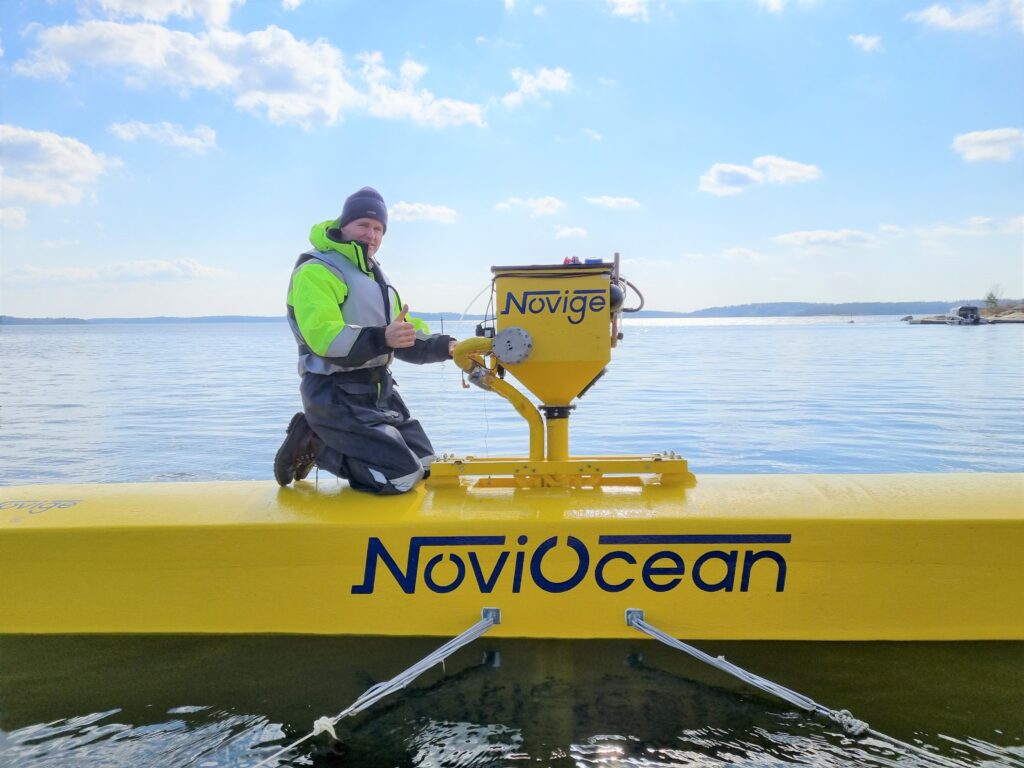
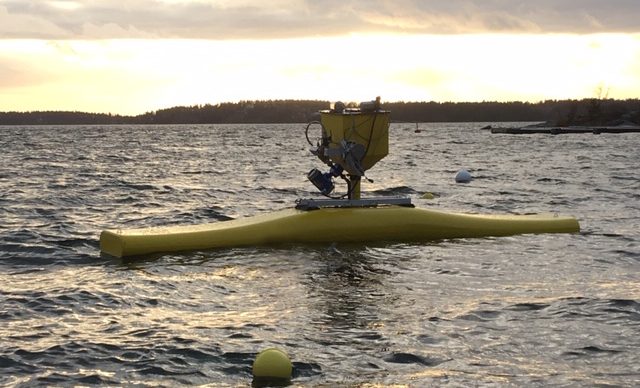
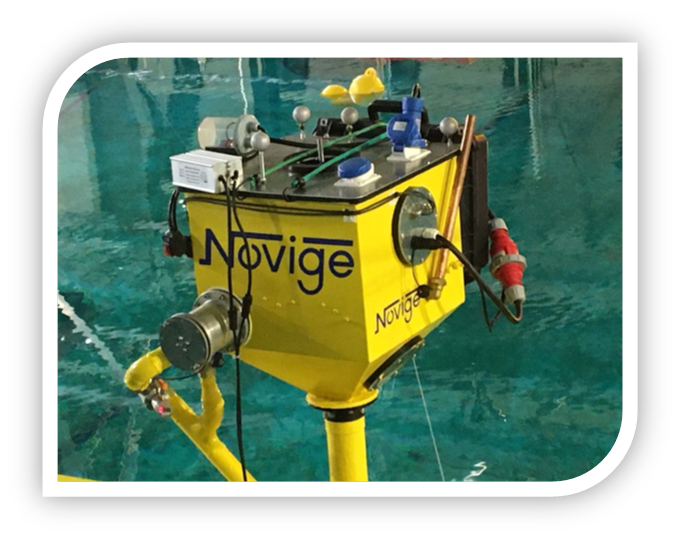
“The Hercules of ocean energy”
HPAS Concept: “Hydro power plant at sea”, TRL 6, Hybrid H2+PV
–
–
Awards

–
–
Our Mission
“Saving the climate with profitable wave power”
–
–
Our Goals
•To deliver stable energy from the oceans, at a lower price than offshore wind •
•To globally deploy thousands of units over the coming decades •
•To play a vital role in mitigating the climate crisis
–
–
Essentials
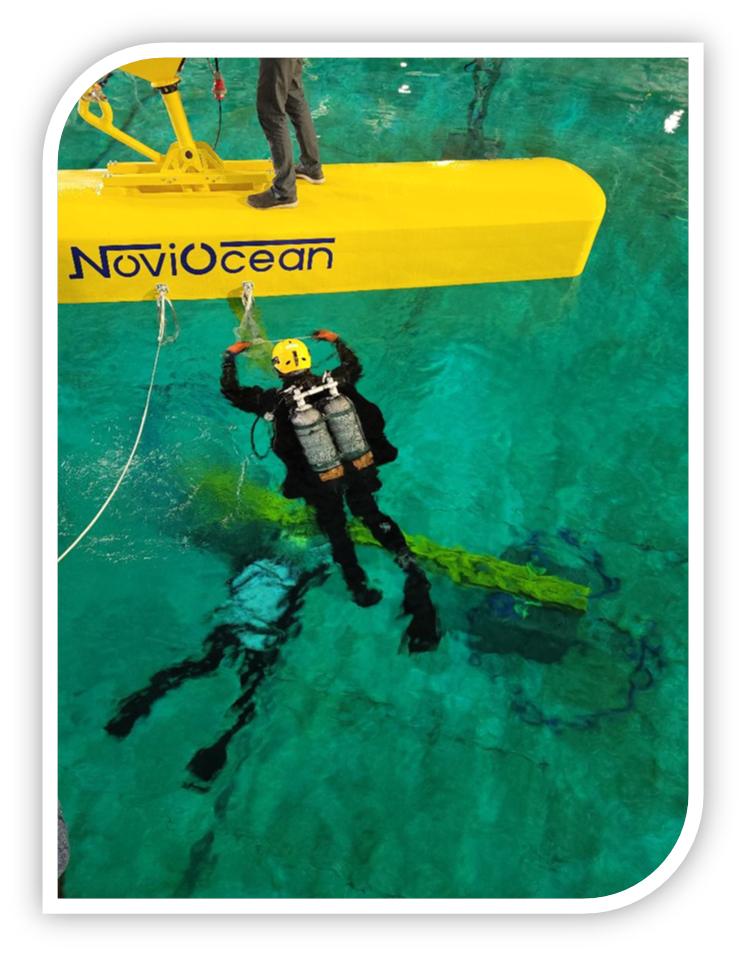
•Validated with high certainty through third-party simulations. (WavEC)
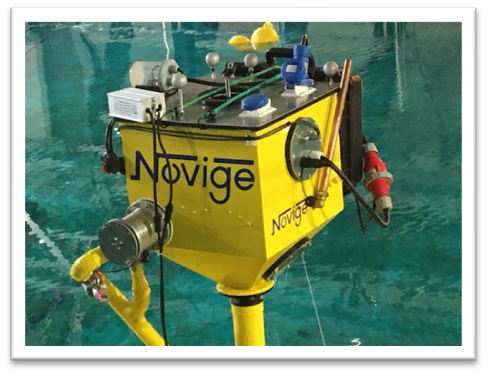
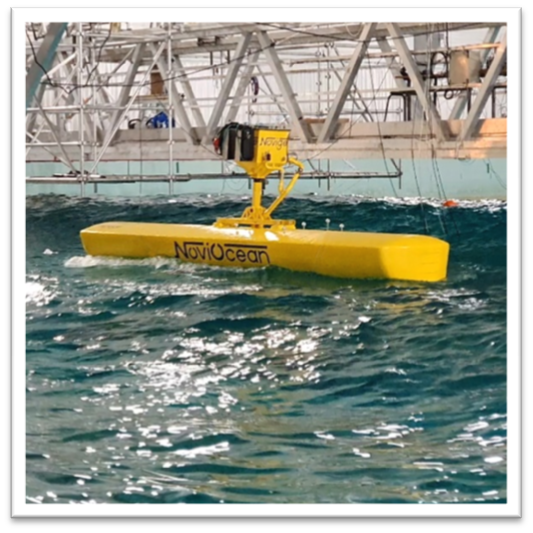
•Test-rig runs, tank testing and offshore testing, confirming the simulations
•Full-scale rated at 500 kW (later 2+ MW). Capacity Factor at 50% (250 kW) in medium locations!
•Three approved patents, applied for in 20 countries
•EU grant received, now developing full scale for 2025
•Open for dialogue with potential partners
•The EU Commission will use funding as required to meet 40 GW by 2050
(10% of market = 8,000 NoviOcean 500 kW units/12 billion EUR…)
–
–
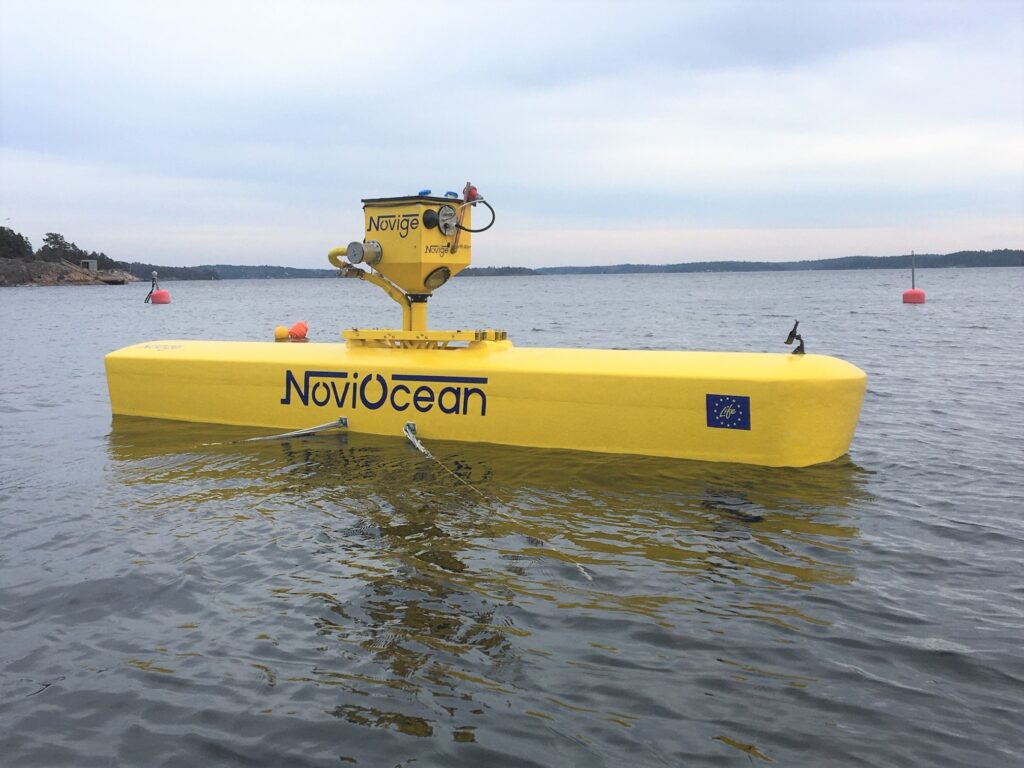
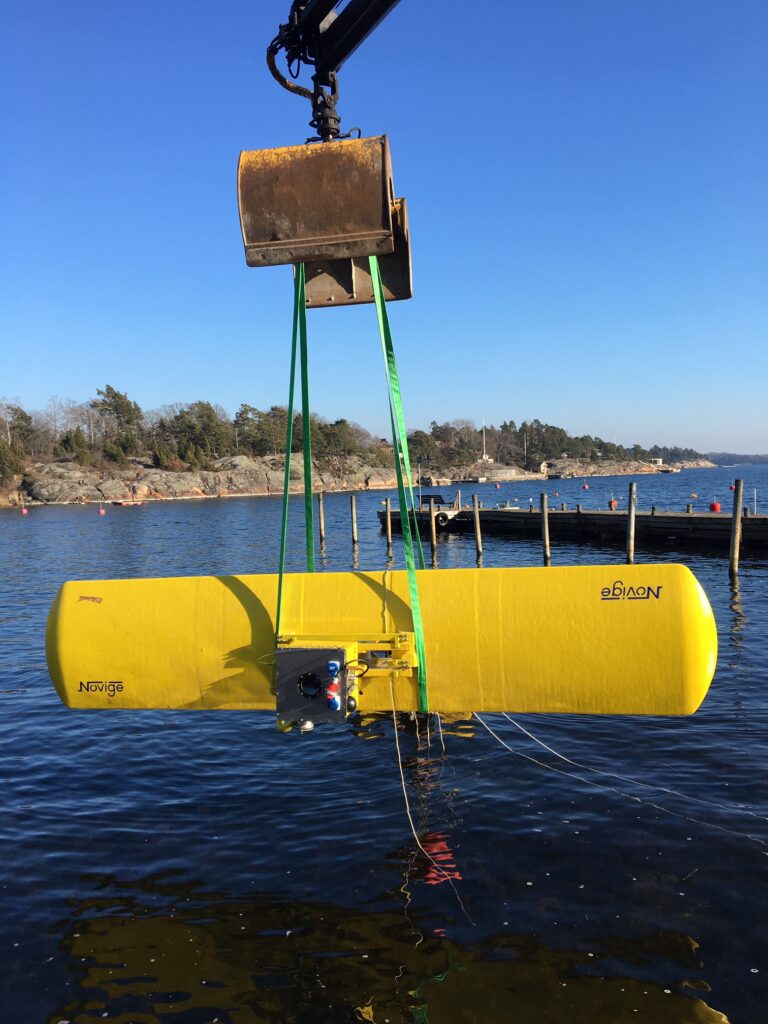
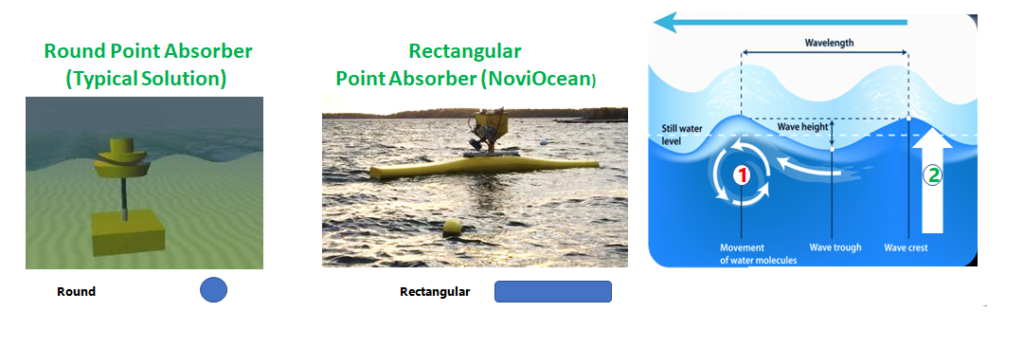
● 1.The rectangular shape resembles the wave´s shape, lifts 4-10 times more.
● 2.When in the wave trough, the lowest point, the valve closes, holding the float in a fixed position relative the sea floor.
● 3.The wave rises around the float, and up to three meters of the float is locked below water.
● 4.600 cubic meters of air is trapped below surface.
●5.At correct pressure, the valve opens, 600 tons of lifting force pushes high pressure water onto the Pelton turbine, turning the generator.
–
–
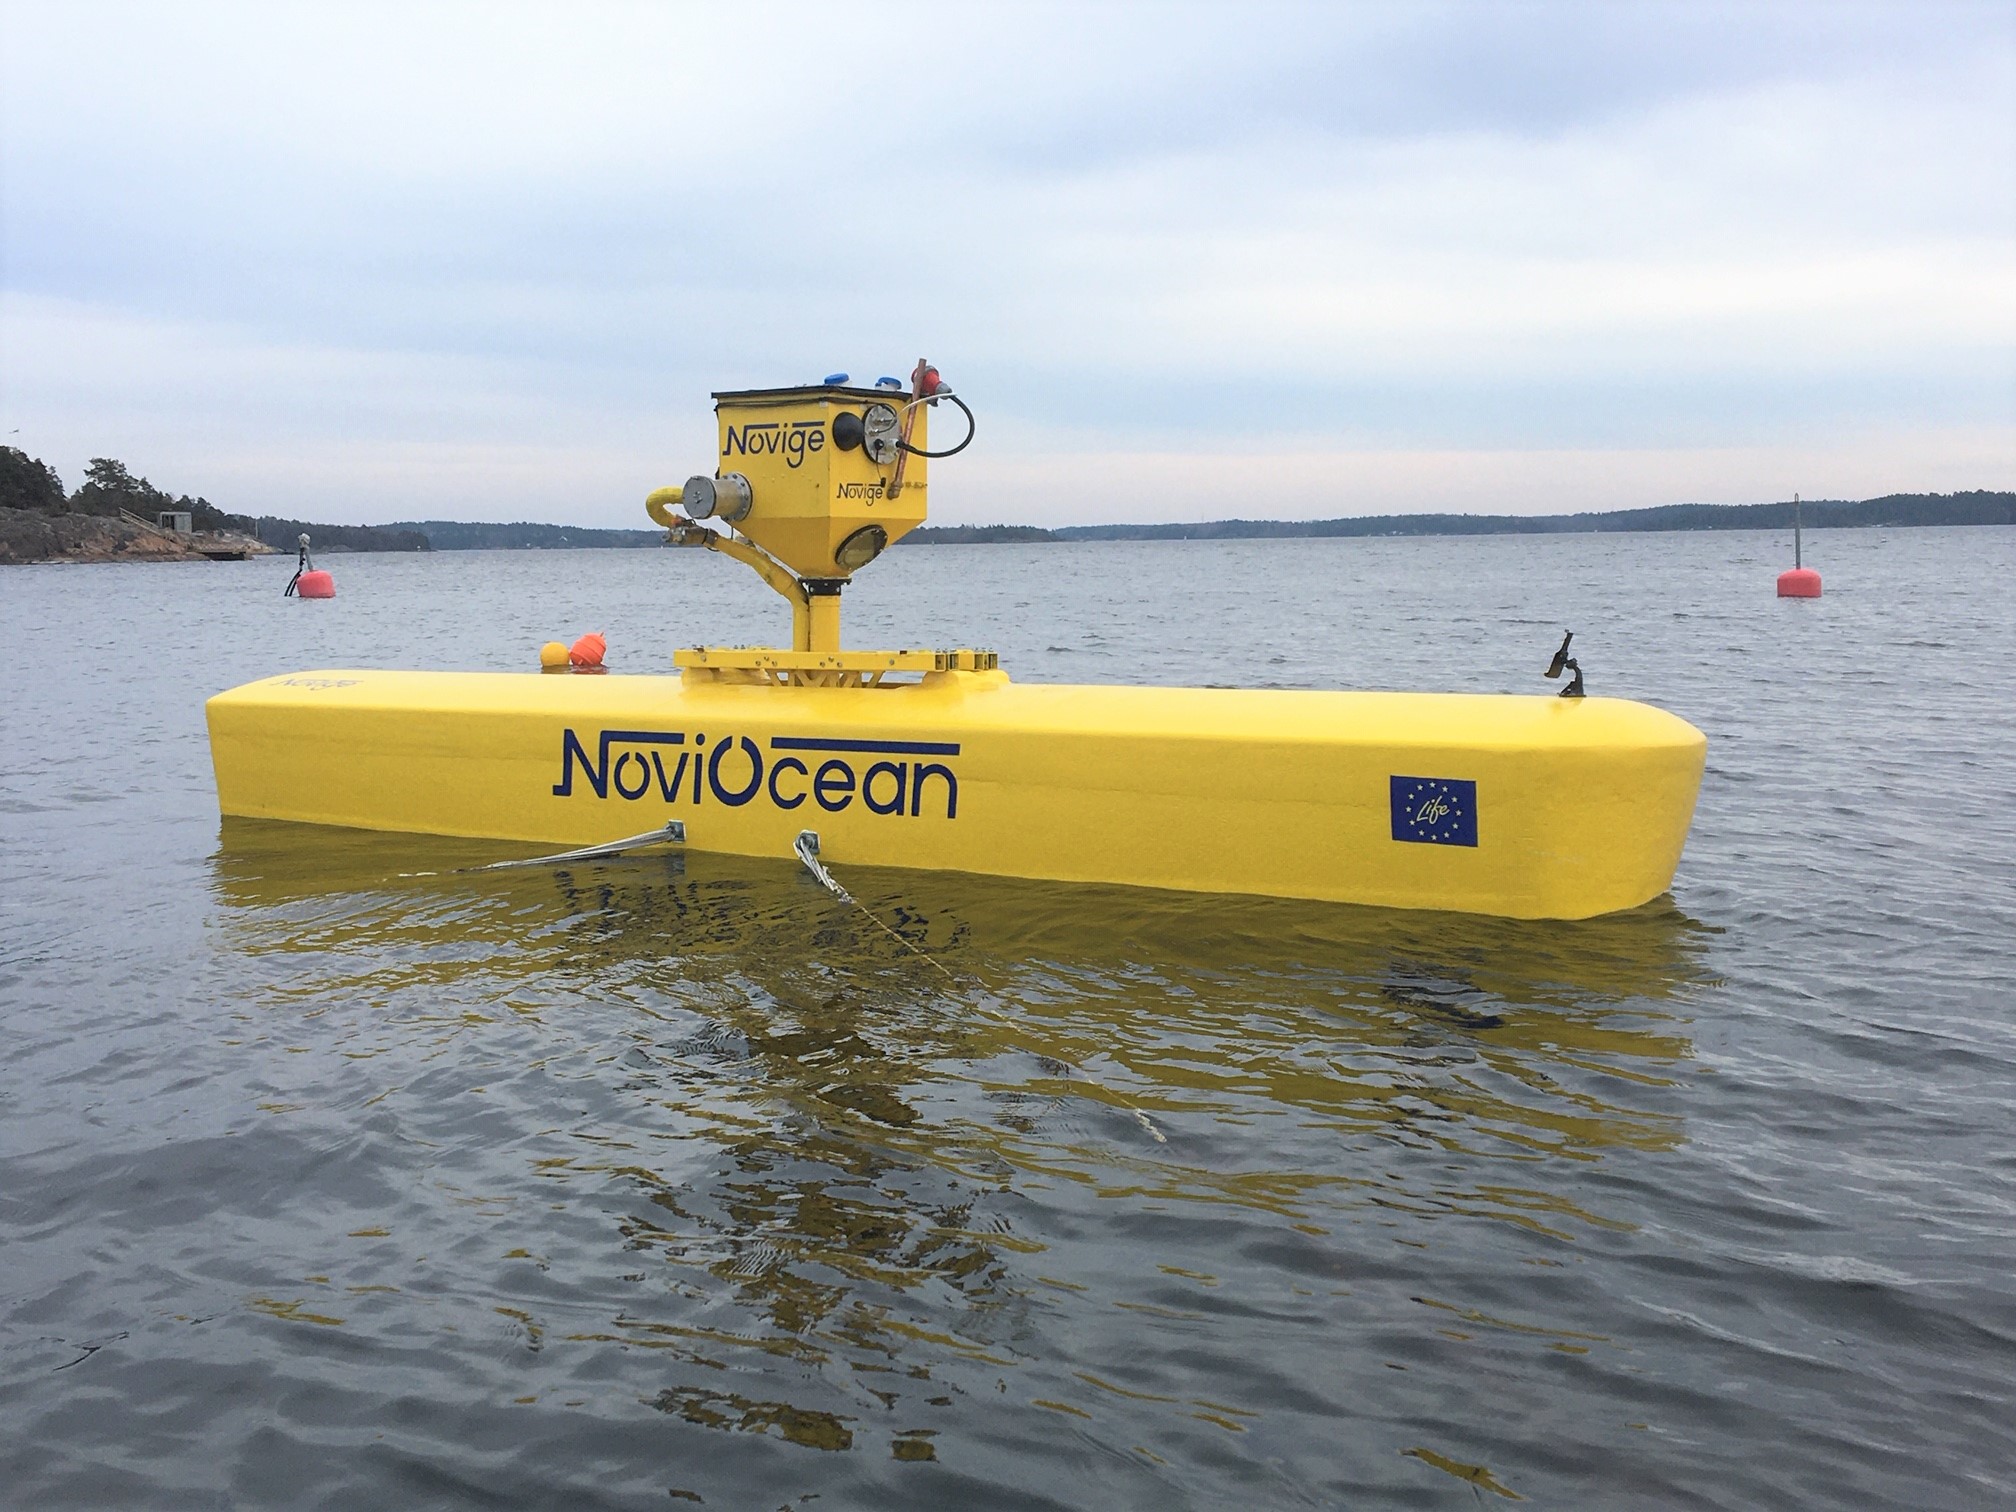
Working Principles
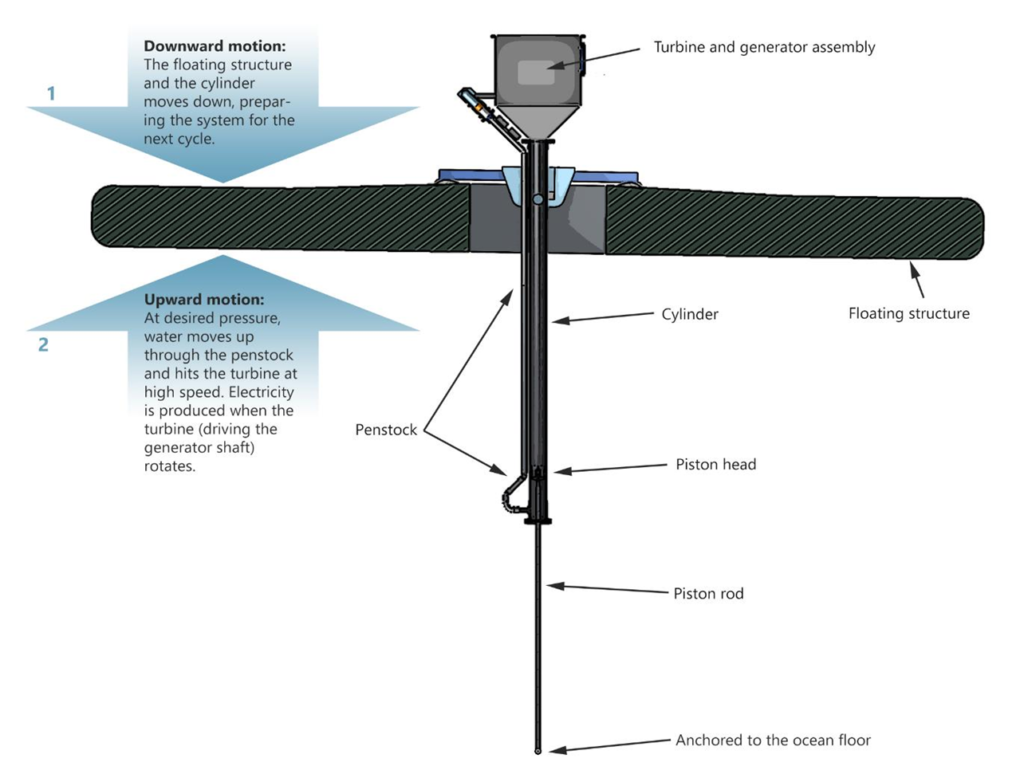
● Based on 3 well proven and simple parts:
1)a large float
2)a hydraulic cylinder
3)a Pelton turbine
● Simply the well-proven hydro power plant, taken to sea and inverted, fully patented
Converting the slow wave motion to high-speed generator RPM, in the most simple and well proven way.
Lifting force vs surge force is 20-1!
–
–
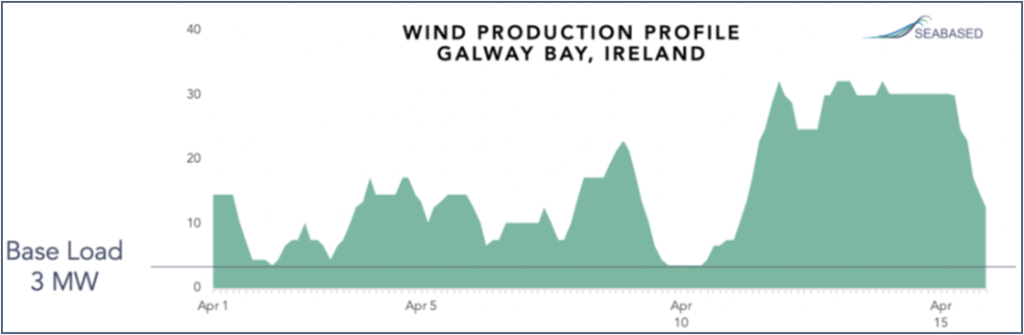
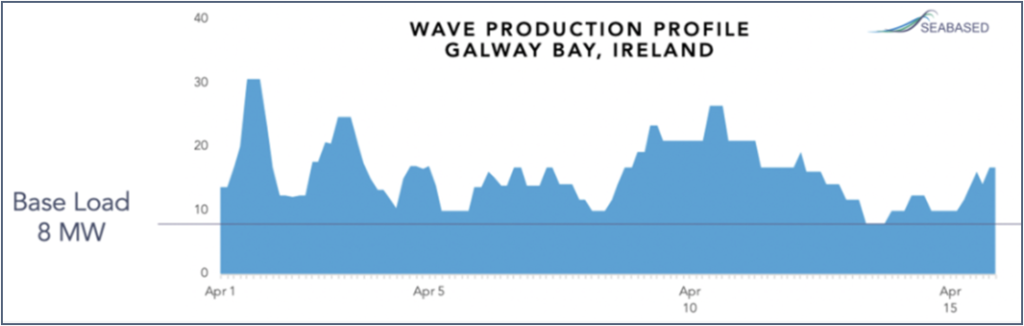
How are the grids doing?
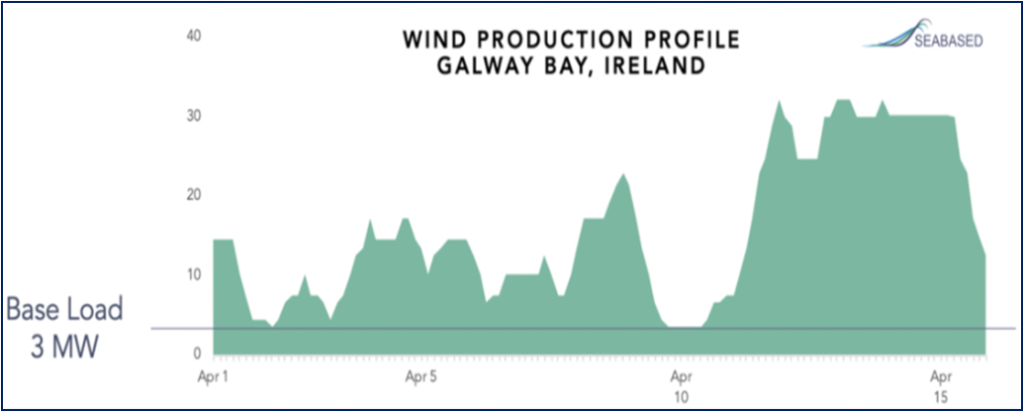
Baseload in this case is only 10% of peak capacity
•Grids already unstable with present wind + solar. Target is 10x by 2050
•The problem and carbon payback time will be exponential if mainly intermittent wind and solar are to be used:
Strategy 1: Wind and Solar with Backup Fossil Power Plants
•The energy that’s saved on fossil fuel is spent mostly on the manufacturing, installation and interconnection.
Strategy 2: Oversizing Renewable Power Production
•With 80% renewables, capacity needs to be 6x peak load.
•Carbon payback time 12-24 years, far too long.
–
–
Grids cont
Strategy 3: Supergrids to balance supply vs. demand using long distance electricity transfer
•With 60% intermittent renewables, grid capacity needs to be 7x.
•Land/local opposition, bureaucratically difficult/impossible, low utilization, high costs vs use, carbon payback time far too long.
Strategy 4: Energy Storage
•For 100% renewable by wind & solar, storage 15 times the annual energy use in Europe.
•Costs 100 EUR/MWh. Total carbon payback time with wind/solar 5-15 years.
–
Conclusion:
•Wind and solar and these four strategies = carbon payback time too long.
•Not meeting the 2030/2050 goals.
•Much higher level of stable renewable energy is needed to stop this crisis.
–
Case in Germany:
Wind plus solar from 5-50% the demand.
Not meeting the daily steady requirement by far. More than 60% demand at night.
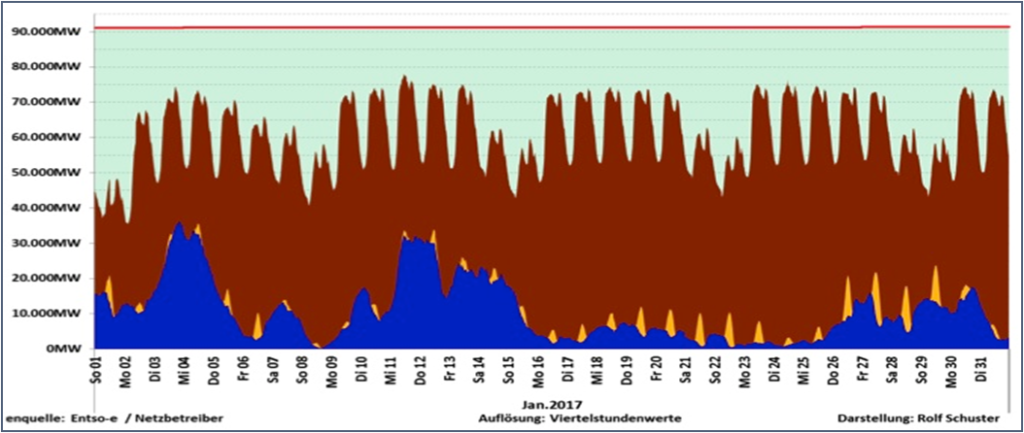
Brown: Total demand
Blue: Wind
Yellow: Solar
–
–
How to solve?
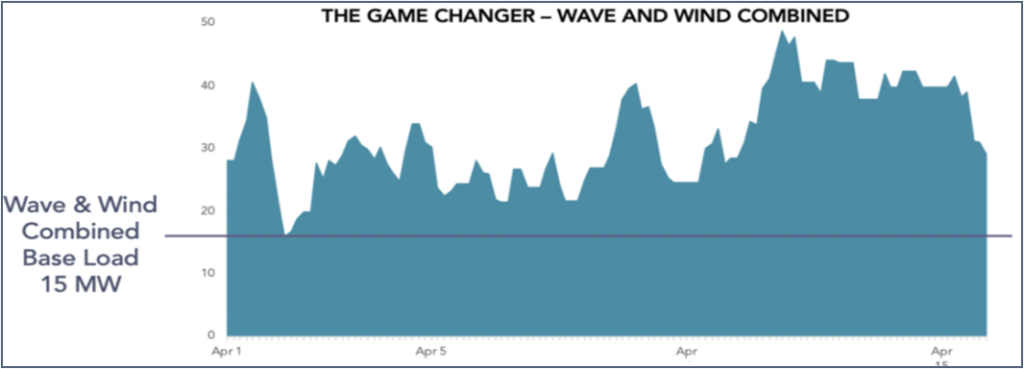
•Wave power 2.5 x more stable than wind power
•Hybrid wind/wave increases baseload by 4 x = less wind/solar and much less storage and super-grids needed = lower carbon payback time.
Conclusion:
•Large scale stable marine energy is needed, combined with wind and solar, to make the Global Goals achievable.
•To reach the EU-Commission´s targets it is crucial to invest time and money in the most logical concepts.
• Question is, which are they and why?
–
–
These common concepts work primarily by resisting the moving water particles
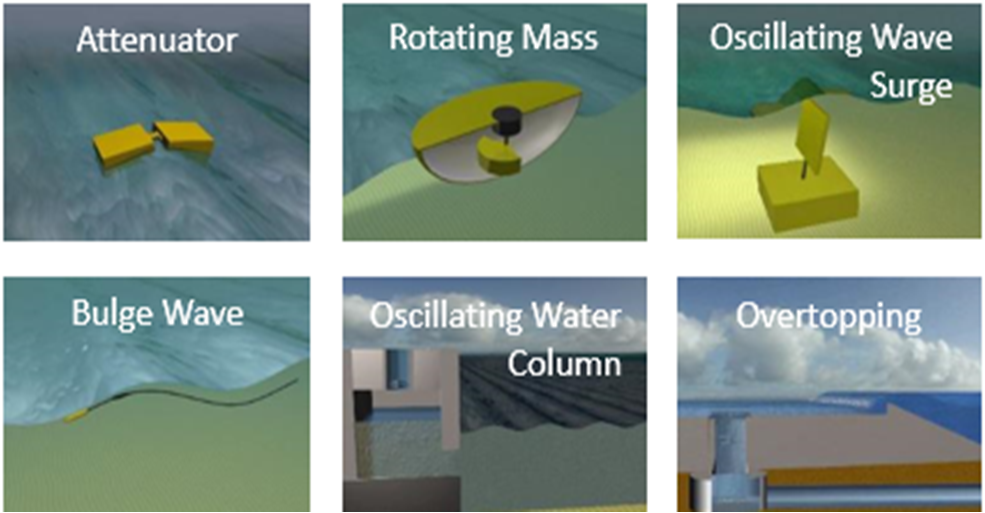
How effective are they?
(One might ask why even the leading developers and most others reveal no more than the irrelevant rated power. The average power or Capacity Factor is what creates revenue. Not the rated power which might be reached only once a month! The following pages will explain the reason the real performance is kept in secret except for a few brave ones
–
–
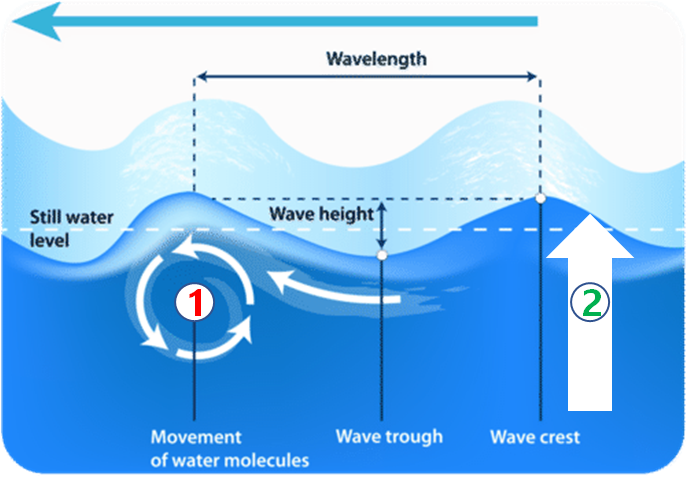
Particle resistance with the use of Newtons law = 3% the extracted force vs buoyancy / Archimedes
•NoviOcean’s lifting force by buoyancy is 600 tons in four-meter waves.
Area 38 x 7 meters •The solutions not using buoyancy need 29 x our area for similar force •In practical terms 770 x 10 meters… Near shore at best 250 x 10 meters
Conclusion:
•To extract high amounts of energy per ton material in the ocean, buoyant concepts are required to be economical and reach a low LCA
(We are happy to provide the calculation on request)
–
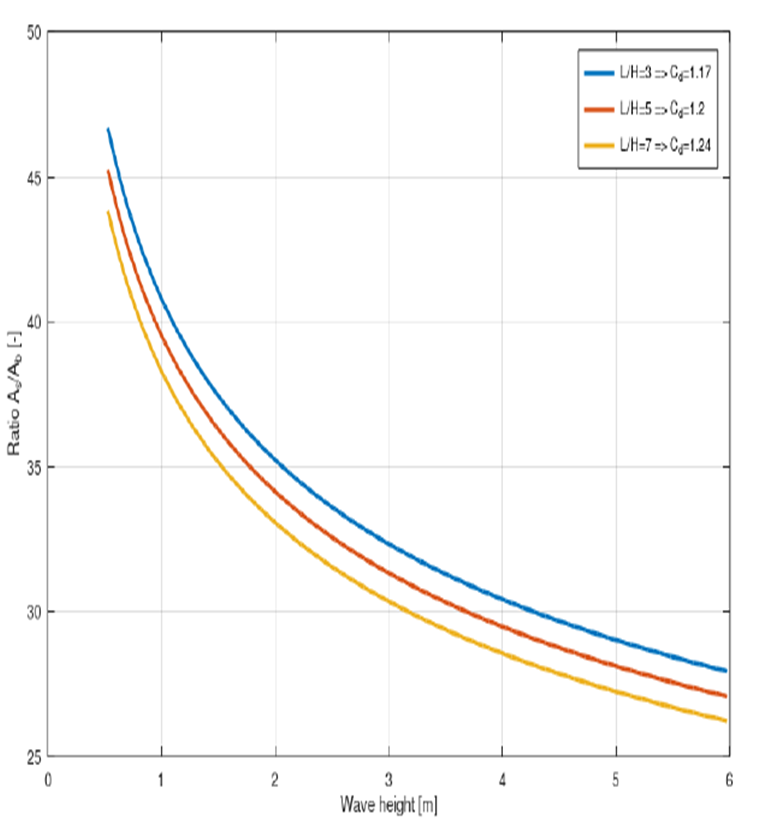
Graph:
X-factor buoyancy force vs. water particles force
Y-axis is ratio area needed in water if particles is used vs buoyancy
–
–
What concepts can have low weight, low costs and low carbon payback time?
•Buoyancyforce by the laws of Archimedes is the clear winner! (2)
•Huge force possible relative size and weight, then two types to choose from:
–
–
Which to choose?

Round or Rectangular?
Round:
•Lifts max 150 tons with the max practical diameter of 10 meters
•Average power at medium site, 75 kW •
Rectangular:
•Lifts 600 tons, four times more (Patented)
•Average power at medium site 250 kW, (25-38 x 8 m. float size)
•In next stage 2 MW rated and 1 MW average the target. Larger float and PTO
–
–
Cogwheels or Hydro power?
Translating 0.5 m/s wave motion to 1000 rpm
Cogwheels, Wires, Accumulators:
•To lift 600 tons, needing xx giant heavy costly cogwheels or accumulators, in high numbers. Complexity, weight and reliability a huge challenge . •
Hydraulic Cylinder & Hydro Power Plant:
•Can easily take this force, water to metal contact, lasts for 30+ years, small turbine, light and durable, both well-proven over 200 years.
–
–
Which to choose?
Resonant, moving with same or higher amplitude than the wave:
•Deep in the water due to high weight with high surge forces
•Difficult timing and loading due to constant change of waves’ height/length
•Moves fast vertically with high amplitude
•Requires complex expensive machinery
Non-resonant, moving with a lower amplitude than the wave:
•Moves slowly only for ½ wave height with high force, less wear, simpler machinery
•Light, with low free-floating draft. Like a large surfboard, providing high survivability
•Anchoring/surge forces measured at only 1/20 of lifting, unique in wave power
•Latches in wave through, no timing needed, released when pressure is attained
–
–
Conclusions:
To extract 3-10 times more power per unit and
To be economical and with low LCA, providing stable and secure energy and
To last for 10 000 cycles per day, you need to:
Use buoyancy
To be attached to the seafloor to fully extract the buoyancy lifting force
To be rectangular, to extract 3-4 times more power than round units
To use the well proven hydraulic cylinder to take the huge load
To be non-resonant and hit the waves with a simple system
To convert the slow wave motion to high-speed generator rotation with a hydro power plant
To be high in the water with low relative surge forces to survive
Then, to achieve similar costs per MWh as offshore wind before 50 MW deployed
And to achieve a carbon payback time of less than two years
We believe there is only one logical answer to all of the above: NoviOcean
–
–
Cost of Energy (LCOE)
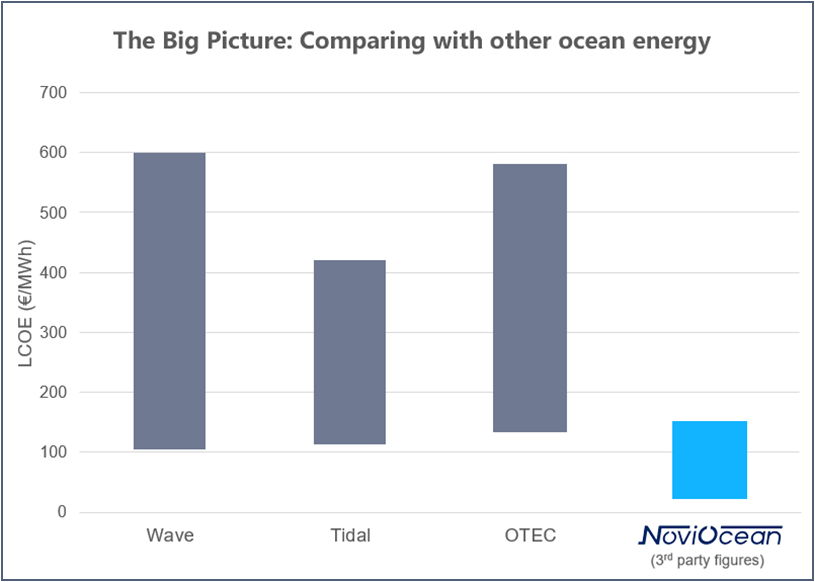
Based on varying locations, our calculations shows:
First 3 MW array/six units:
•120-160 €/MWh
First 5 MW/10 units array after the initial 3 MW array:
•Costs: 80-125 €/MWh (after this, lower LCoE than same size offsh. wind) •Feed In Tariffs/subsidies: 150 €/MWh •IRR: 5-15%
After 500 MW deployed:
•Costs: 25 €/MWh (with offshore wind´s learning curve) •Lower than any other stable energy source, green or fossil
(Output based on third party and tests, CAPEX, OPEX and LCOE on combination of third party and Novige)
–
–
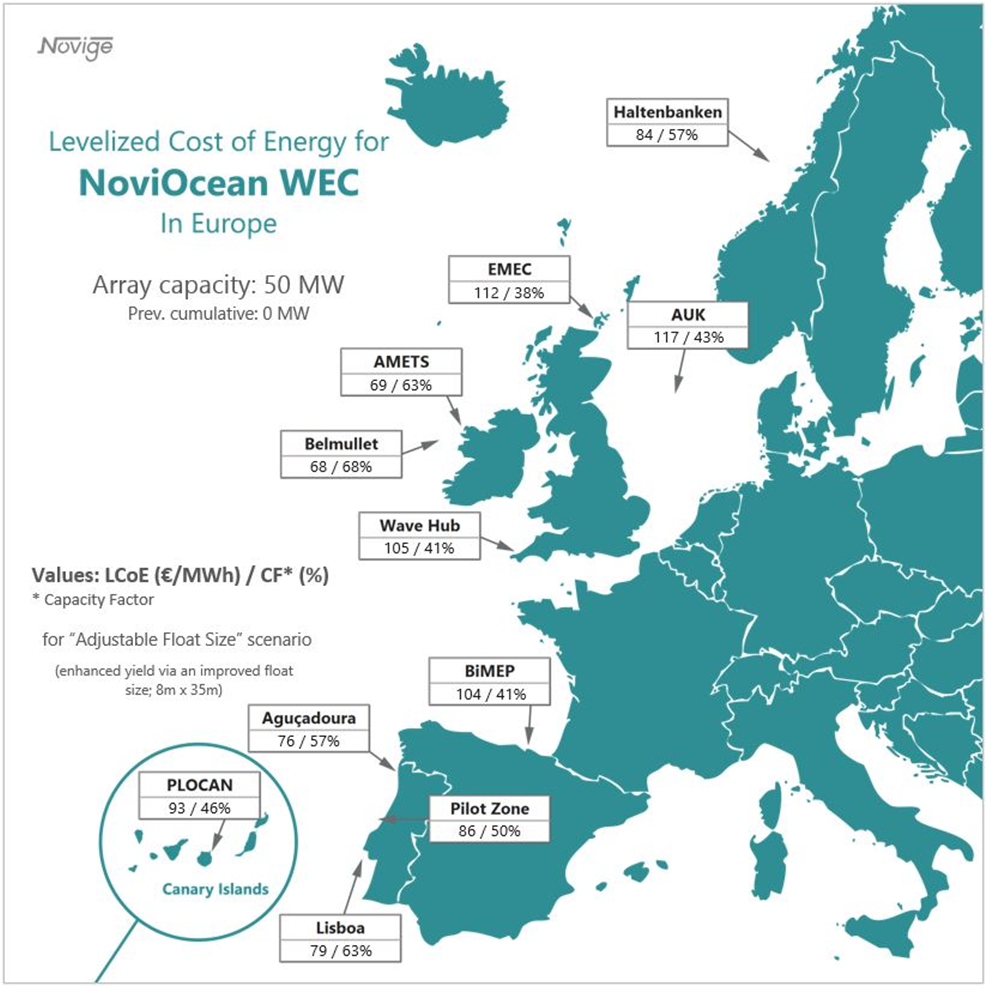
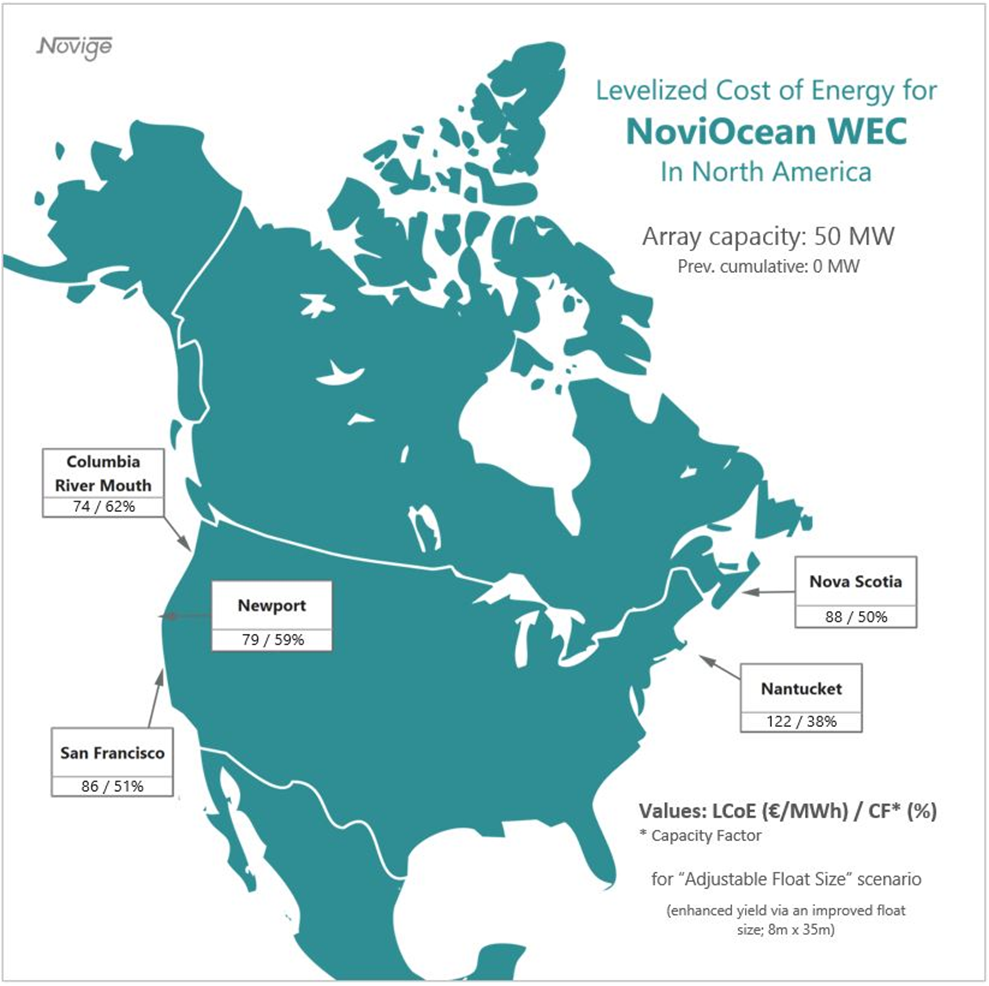
Cost of Energy (LCOE)
–
–
Projections
4 GW deployed
our 2050 ambition (10% of EU Commission’s ocean energy target)
–
–
Revenue Model
How to be deployed globally in the thousands
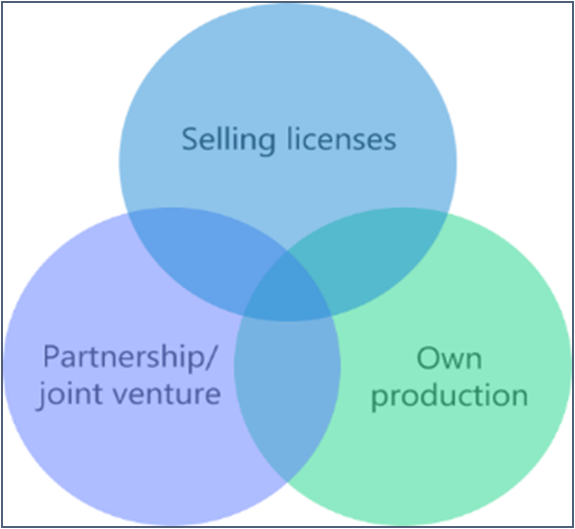
1-Selling priceworthy global licenses; adding to local employment and competence; 150 k€ per unit, with support
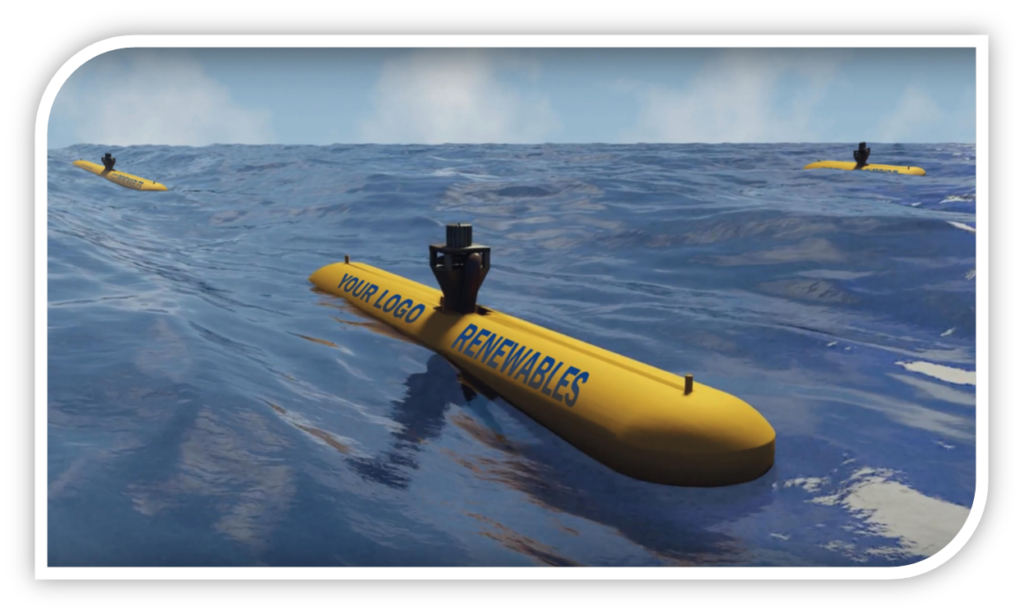
2-Partnership or joint venture with global industrial or utility companies, motivated also by 35 x 3-meter “XXXXX RENEWABLE” logo on each side. (The largest and most effective green billboard you will ever find!)
3-Own production (deployment & maintenance at a smaller scale); 2 M€ per unit
–
–
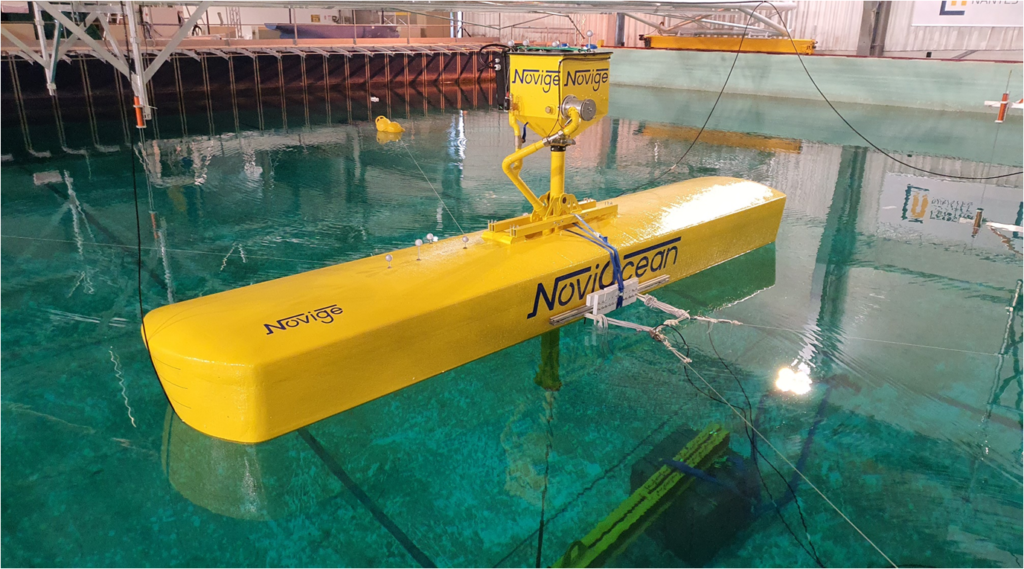
Structured Product Verification
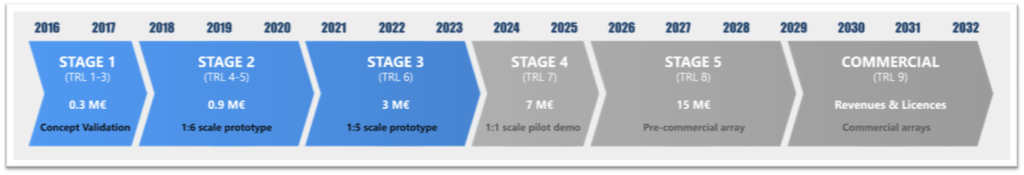
•We follow a structured five-stage product verification process, introduced by International Energy Agency OES and ETIP Ocean.
•Stage 1: 3rd party simulations, numerical modeling, international patents.
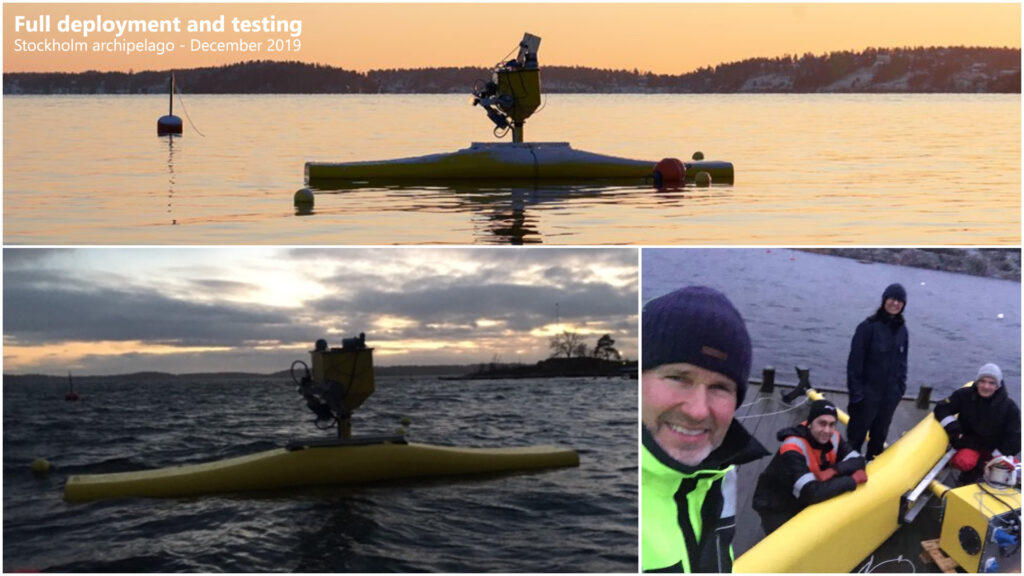
•Stage 2: System verification via dry lab testing, wave tank, and offshore tests.
•Currently (Stage 3): Further wave tank testing, finetuning the prototype in test rig (at KTH university), sea testing in winter 2022 with remote control, as well as design work of the full scale 500 kW pilot.
–
–
Plan Forward
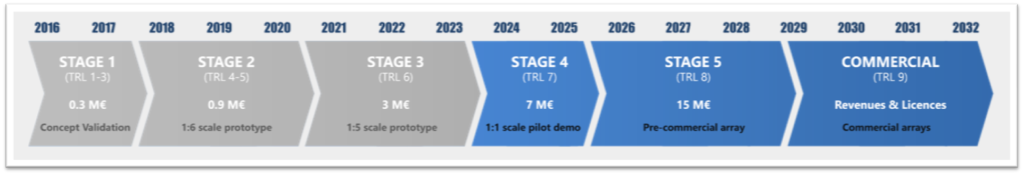
•Stage 4: Fully construct, deploy and certify the full-scale pilot (planned by 2025)
•Stage 5: Commissioning the pre-commercial array (3-6 units); comprehensive subsystem verification and array certification (planned by 2029).
•Commercial stage: Initiating in areas with strong subsidies for CAPEX/OPEX/FIT like EU or Canada, as well as in islands and remote locations with high electricity prizes due to off-grid diesel reliance. Gradually moving to areas with less need for subsidies/FIT’s as our LCOE goes lower than cost for offshore wind.
–
–
Customers
Local Shipyards & Manufacturers: •A huge opportunity as licensees •
Utility Companies:
•Instead of purchasing expensive battery storage, for the same money almost double the energy output. On board hydrogen production and storage
•Stable grids and much lower LCA emissions
2000 Remote Islands & Off-grid Communities:
•12 000 MW requirement, 24/7 stable output
•Not visually obstructive or audibly disturbing like wind power, no land use
Oil & Gas Companies:
•For their offshore platforms using 10-20 MW of fossils constantly
•Important to greenify their brand
Offshore Wind Farm Owners:
•4 x more stable output by using hybrid wind/wave
•No battery storage needed, lower LCA
•Leveraging higher spot prices
–
–
Potential Partners
Oil & Gas Companies (e.g., Total, Equinor, Shell, BP, PTTEP):
•Most to gain due to falling share prices, market topping and falling for decades
•A new giant virgin market to transition to (avoid Kodak experience)
Utility Companies (e.g., Enel, EDF, EDP, Engie, AEP):
•Need stable energy, access to a new global market
•No battery storage needed with NoviOcean, complementary to wind
Wind Power Producers (e.g., Vestas, Siemens):
•They can offer customers a better total product
•Selling more wind turbines as the grids will be more stable due to wave energy
Subcontractors (e.g., ABB, Voith, Siemens, GE):
•To secure a huge future market share and greenify their brands
Shipyards and Large Industrial Companies:
•Access to a new giant global market
•Transition from fossil fuels and greenify their brands
–
–
–
–